|
01627500
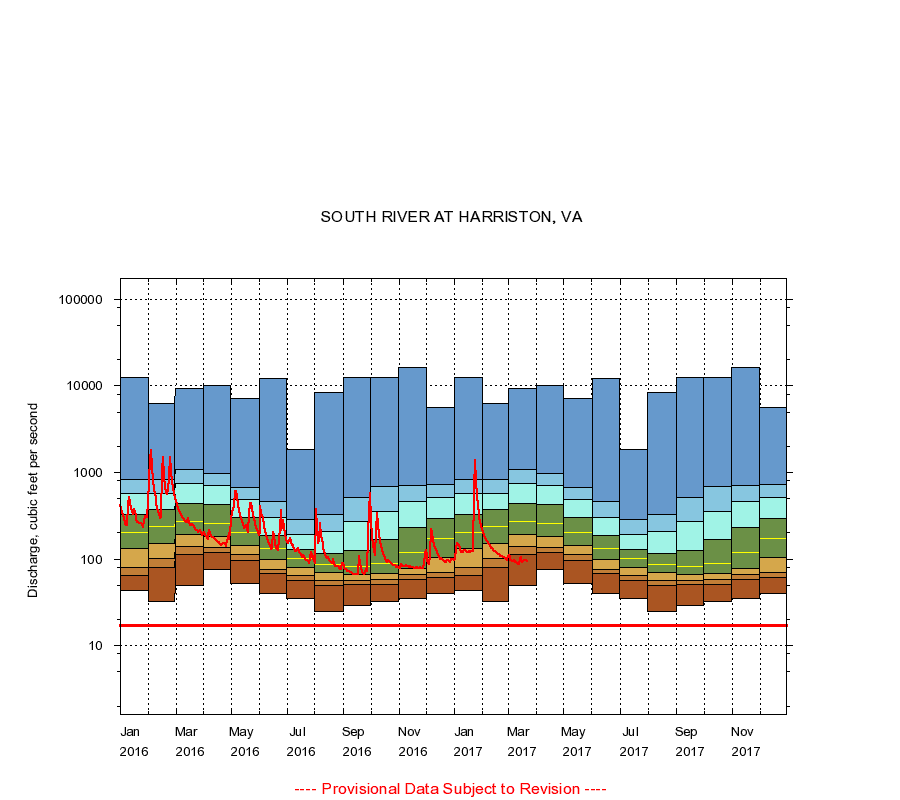
SOUTH RIVER AT HARRISTON, VA
|
Minimum daily flow
|
|
|
5th percentile
|
|
|
|
10th percentile
|
|
|
|
|
25th percentile
|
|
|
|
|
|
Median
|
|
|
|
|
|
|
75th percentile
|
|
|
|
|
|
|
|
90th percentile
|
|
|
|
|
|
|
|
|
95th percentile
|
|
|
|
|
|
|
|
|
|
Maximum daily flow
|
|
|
|
|
|
|
|
|
|
|
|
Years of record
|
January
|
43.0
|
65.0
|
79.0
|
132
|
200
|
327
|
579
|
820
|
12,500
|
|
73
|
February
|
32.0
|
78.8
|
102
|
152
|
238
|
373
|
575
|
831
|
6,200
|
|
74
|
March
|
49.0
|
113
|
140
|
192
|
274
|
438
|
753
|
1,090
|
9,330
|
|
74
|
April
|
76.0
|
119
|
136
|
184
|
260
|
422
|
712
|
985
|
10,100
|
|
74
|
May
|
52.0
|
96.8
|
113
|
142
|
201
|
305
|
485
|
675
|
7,220
|
|
74
|
June
|
40.0
|
68.0
|
76.0
|
98.0
|
132
|
189
|
300
|
459
|
12,300
|
|
74
|
July
|
35.0
|
56.0
|
64.0
|
80.0
|
101
|
130
|
191
|
285
|
1,830
|
|
74
|
August
|
25.0
|
49.0
|
57.0
|
70.0
|
86.0
|
117
|
208
|
327
|
8,490
|
|
74
|
September
|
29.0
|
51.0
|
57.0
|
67.0
|
81.0
|
127
|
274
|
520
|
12,500
|
|
74
|
October
|
32.0
|
51.0
|
58.0
|
68.0
|
89.0
|
170
|
358
|
695
|
12,600
|
|
73
|
November
|
35.0
|
58.0
|
66.0
|
78.0
|
118
|
230
|
467
|
702
|
16,400
|
|
73
|
December
|
40.0
|
62.0
|
70.0
|
105
|
174
|
296
|
513
|
732
|
5,620
|
|
73
|
|
|
Instantaneous minimum flow for period of record =
17.0
cubic feet per second.
The current daily value for 03/22/2017 is 93.0 cubic feet per second.
----
Provisional Data Subject to Revision ----
|