|
01656000
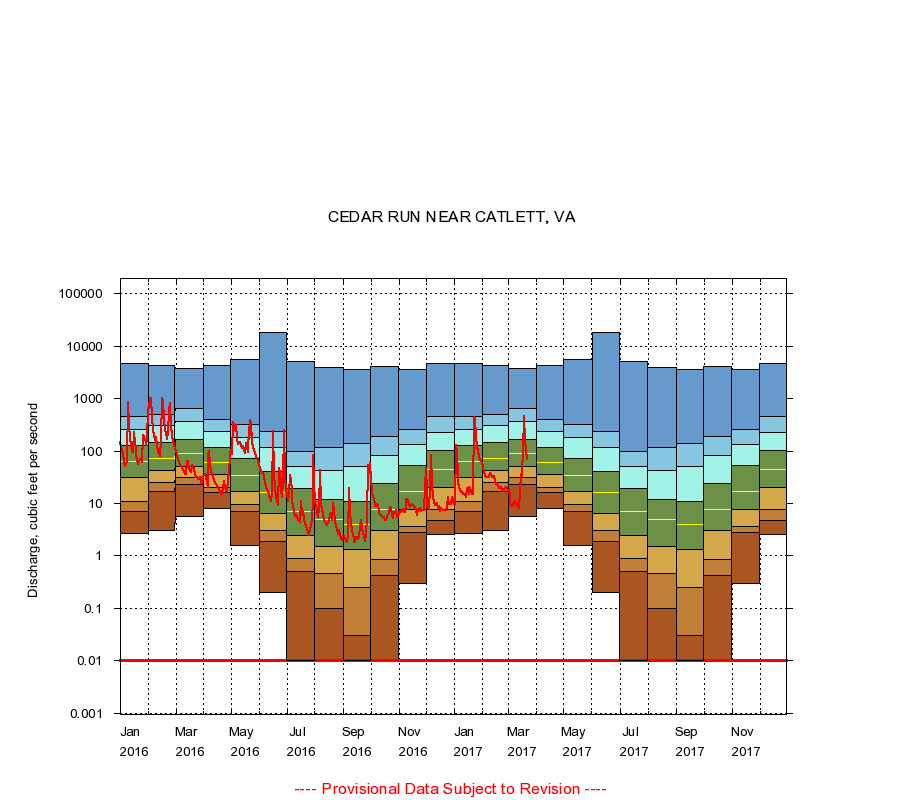
CEDAR RUN NEAR CATLETT, VA
|
Minimum daily flow
|
|
|
5th percentile
|
|
|
|
10th percentile
|
|
|
|
|
25th percentile
|
|
|
|
|
|
Median
|
|
|
|
|
|
|
75th percentile
|
|
|
|
|
|
|
|
90th percentile
|
|
|
|
|
|
|
|
|
95th percentile
|
|
|
|
|
|
|
|
|
|
Maximum daily flow
|
|
|
|
|
|
|
|
|
|
|
|
Years of record
|
January
|
2.70
|
7.00
|
11.0
|
32.0
|
64.0
|
130
|
264
|
450
|
4,770
|
|
62
|
February
|
3.10
|
17.0
|
25.0
|
42.0
|
73.0
|
144
|
305
|
507
|
4,320
|
|
62
|
March
|
5.70
|
23.0
|
31.0
|
50.0
|
89.0
|
166
|
373
|
647
|
3,710
|
|
62
|
April
|
8.10
|
16.0
|
20.1
|
35.0
|
61.0
|
118
|
241
|
408
|
4,360
|
|
62
|
May
|
1.60
|
7.00
|
9.60
|
16.8
|
34.0
|
72.0
|
178
|
317
|
5,710
|
|
62
|
June
|
0.20
|
1.90
|
3.00
|
6.40
|
16.0
|
41.0
|
115
|
235
|
18,500
|
|
62
|
July
|
0.00
|
0.50
|
0.90
|
2.40
|
6.90
|
19.0
|
50.0
|
100
|
5,100
|
|
62
|
August
|
0.00
|
0.10
|
0.47
|
1.50
|
4.85
|
12.0
|
43.0
|
118
|
3,890
|
|
62
|
September
|
0.00
|
0.03
|
0.25
|
1.30
|
4.00
|
11.0
|
50.8
|
138
|
3,530
|
|
62
|
October
|
0.00
|
0.43
|
0.86
|
3.00
|
7.60
|
24.0
|
82.6
|
192
|
4,130
|
|
63
|
November
|
0.30
|
2.80
|
3.70
|
7.80
|
17.0
|
53.0
|
136
|
253
|
3,560
|
|
63
|
December
|
2.60
|
4.80
|
7.54
|
20.0
|
44.0
|
103
|
228
|
448
|
4,760
|
|
63
|
|
|
Instantaneous minimum flow for period of record =
0.00
cubic feet per second.
Flow values of 0.00 are plotted as 0.01
The current daily value for 03/22/2017 is 70.0 cubic feet per second.
----
Provisional Data Subject to Revision ----
|