|
|
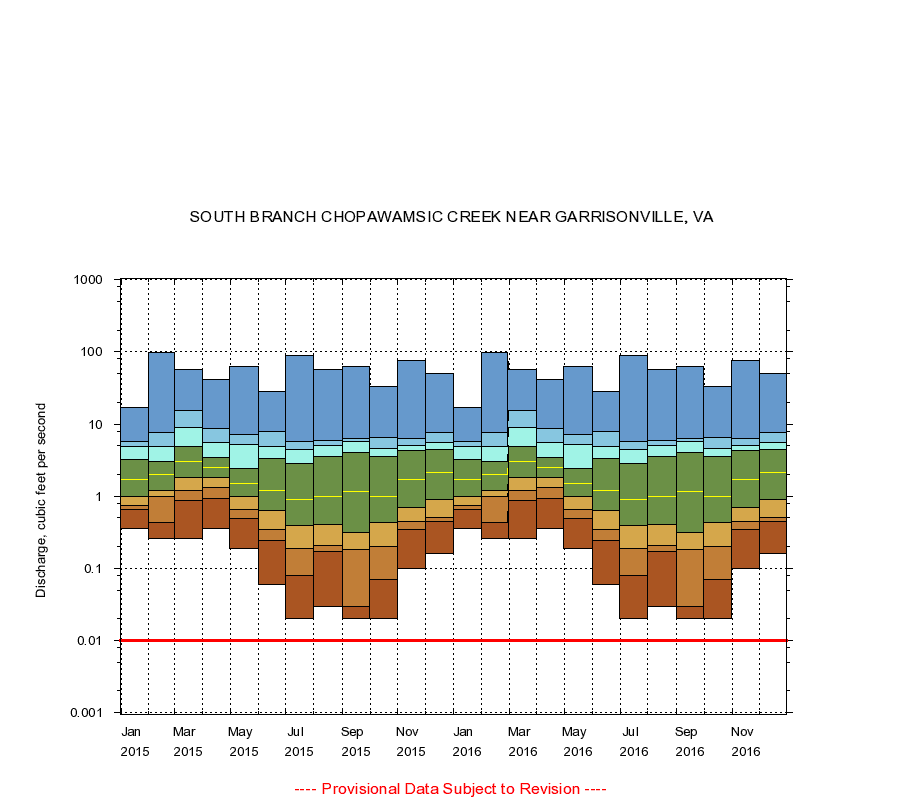
01660000 SOUTH BRANCH CHOPAWAMSIC CREEK NEAR GARRISONVILLE, VA
|
|
|
LOCATION.--Latitude 38°32'22", Longitude 77°25'30", North American Datum of 1927,
Stafford County, VA, Hydrologic Unit 02070011.
|
|
|
DRAINAGE AREA.--2.46 square miles.
|
|
|
PERIOD OF RECORD.--May 1951 to June 1957, March 2000 to December 2003, January 2007 to current year.
|
|
|
DURATION STATISTIC COMPUTATION PERIOD.--All data through September 2015.
|
|
|
REGULATION.--Some regulation of stream flow from unknown source.
|
|
|
GAGE OPERATION.--U.S. Geological Survey, Virginia Water Science Center.
|
|
|
|