|
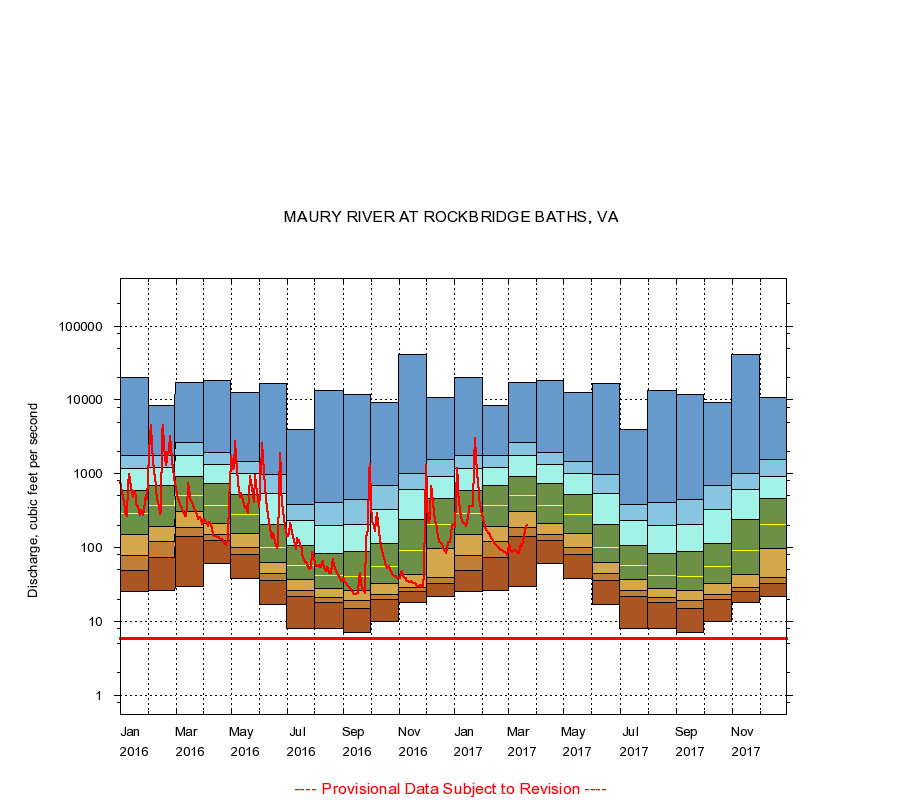
02021500
MAURY RIVER AT ROCKBRIDGE BATHS, VA
|
Minimum daily flow
|
|
|
5th percentile
|
|
|
|
10th percentile
|
|
|
|
|
25th percentile
|
|
|
|
|
|
Median
|
|
|
|
|
|
|
75th percentile
|
|
|
|
|
|
|
|
90th percentile
|
|
|
|
|
|
|
|
|
95th percentile
|
|
|
|
|
|
|
|
|
|
Maximum daily flow
|
|
|
|
|
|
|
|
|
|
|
|
Years of record
|
January
|
25.0
|
48.0
|
78.0
|
149
|
285
|
590
|
1,180
|
1,760
|
20,000
|
|
87
|
February
|
26.0
|
73.0
|
119
|
190
|
369
|
682
|
1,220
|
1,750
|
8,430
|
|
87
|
March
|
30.0
|
141
|
185
|
304
|
510
|
908
|
1,760
|
2,660
|
17,000
|
|
87
|
April
|
61.0
|
125
|
150
|
212
|
372
|
746
|
1,330
|
1,950
|
18,500
|
|
87
|
May
|
38.0
|
80.0
|
100
|
155
|
276
|
528
|
991
|
1,480
|
12,400
|
|
87
|
June
|
17.0
|
36.0
|
44.0
|
62.0
|
100
|
207
|
535
|
960
|
16,800
|
|
87
|
July
|
8.10
|
22.0
|
26.0
|
37.0
|
57.0
|
108
|
229
|
379
|
3,980
|
|
87
|
August
|
8.00
|
18.0
|
21.0
|
28.0
|
42.0
|
83.0
|
200
|
404
|
13,600
|
|
87
|
September
|
7.10
|
15.0
|
19.0
|
26.0
|
41.0
|
88.0
|
206
|
443
|
11,800
|
|
87
|
October
|
9.80
|
19.9
|
23.0
|
33.0
|
56.0
|
113
|
325
|
692
|
9,190
|
|
87
|
November
|
18.0
|
25.0
|
29.0
|
43.0
|
90.0
|
237
|
612
|
1,020
|
41,500
|
|
87
|
December
|
22.0
|
33.0
|
39.8
|
96.0
|
205
|
462
|
906
|
1,540
|
10,800
|
|
87
|
|
|
Instantaneous minimum flow for period of record =
5.80
cubic feet per second.
The current daily value for 03/22/2017 is 196.0 cubic feet per second.
----
Provisional Data Subject to Revision ----
|