|
02047500
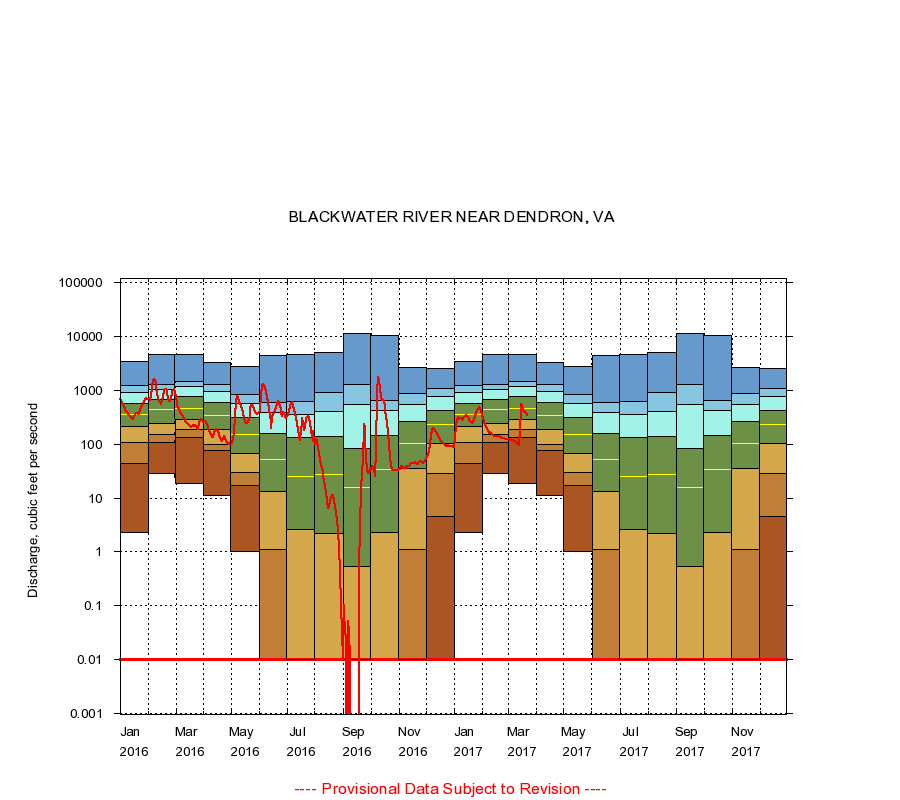
BLACKWATER RIVER NEAR DENDRON, VA
|
Minimum daily flow
|
|
|
5th percentile
|
|
|
|
10th percentile
|
|
|
|
|
25th percentile
|
|
|
|
|
|
Median
|
|
|
|
|
|
|
75th percentile
|
|
|
|
|
|
|
|
90th percentile
|
|
|
|
|
|
|
|
|
95th percentile
|
|
|
|
|
|
|
|
|
|
Maximum daily flow
|
|
|
|
|
|
|
|
|
|
|
|
Years of record
|
January
|
2.30
|
44.0
|
110
|
215
|
360
|
580
|
904
|
1,240
|
3,470
|
|
72
|
February
|
28.0
|
109
|
152
|
242
|
444
|
688
|
1,030
|
1,320
|
4,680
|
|
72
|
March
|
19.0
|
131
|
190
|
292
|
470
|
758
|
1,190
|
1,490
|
4,680
|
|
72
|
April
|
11.0
|
78.0
|
101
|
189
|
336
|
598
|
944
|
1,280
|
3,280
|
|
72
|
May
|
1.00
|
17.0
|
30.0
|
67.0
|
155
|
313
|
574
|
839
|
2,760
|
|
72
|
June
|
0.00
|
0.01
|
1.11
|
13.0
|
53.0
|
160
|
388
|
596
|
4,550
|
|
72
|
July
|
0.00
|
0.00
|
0.00
|
2.60
|
25.0
|
132
|
360
|
624
|
4,600
|
|
72
|
August
|
0.00
|
0.00
|
0.00
|
2.20
|
27.0
|
139
|
410
|
903
|
5,010
|
|
73
|
September
|
0.00
|
0.00
|
0.00
|
0.54
|
16.0
|
82.0
|
559
|
1,270
|
11,400
|
|
73
|
October
|
0.00
|
0.00
|
0.00
|
2.30
|
34.0
|
145
|
422
|
665
|
10,500
|
|
73
|
November
|
0.00
|
0.00
|
1.10
|
36.0
|
104
|
269
|
546
|
877
|
2,700
|
|
73
|
December
|
0.00
|
4.52
|
29.0
|
105
|
230
|
425
|
763
|
1,100
|
2,580
|
|
73
|
|
|
Instantaneous minimum flow for period of record =
0.00
cubic feet per second.
Flow values of 0.00 are plotted as 0.01
The current daily value for 03/22/2017 is 338.0 cubic feet per second.
----
Provisional Data Subject to Revision ----
|