|
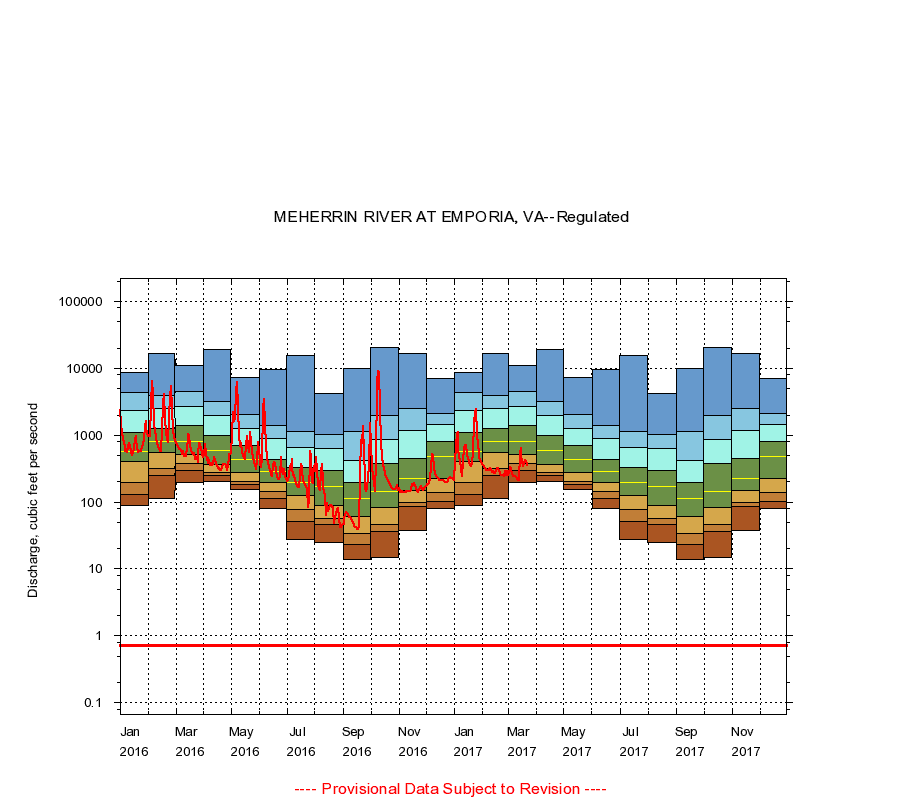
02052000
MEHERRIN RIVER AT EMPORIA, VA
|
Minimum daily flow
|
|
|
5th percentile
|
|
|
|
10th percentile
|
|
|
|
|
25th percentile
|
|
|
|
|
|
Median
|
|
|
|
|
|
|
75th percentile
|
|
|
|
|
|
|
|
90th percentile
|
|
|
|
|
|
|
|
|
95th percentile
|
|
|
|
|
|
|
|
|
|
Maximum daily flow
|
|
|
|
|
|
|
|
|
|
|
|
Years of record
|
January
|
88.0
|
131
|
199
|
402
|
576
|
1,100
|
2,350
|
4,340
|
8,750
|
|
21
|
February
|
115
|
248
|
319
|
554
|
793
|
1,240
|
2,520
|
3,860
|
16,600
|
|
21
|
March
|
198
|
295
|
382
|
522
|
800
|
1,420
|
2,660
|
4,460
|
11,100
|
|
21
|
April
|
204
|
254
|
278
|
368
|
590
|
988
|
1,990
|
3,150
|
19,200
|
|
20
|
May
|
152
|
185
|
203
|
276
|
432
|
702
|
1,280
|
2,020
|
7,400
|
|
20
|
June
|
80.0
|
115
|
144
|
199
|
290
|
438
|
902
|
1,410
|
9,630
|
|
20
|
July
|
28.0
|
52.1
|
78.0
|
124
|
194
|
324
|
665
|
1,130
|
15,500
|
|
20
|
August
|
25.0
|
47.0
|
57.1
|
90.2
|
172
|
300
|
629
|
1,040
|
4,190
|
|
20
|
September
|
14.0
|
23.0
|
34.1
|
61.0
|
113
|
195
|
421
|
1,140
|
9,820
|
|
20
|
October
|
15.0
|
36.0
|
46.0
|
84.0
|
145
|
380
|
859
|
1,980
|
20,700
|
|
20
|
November
|
37.0
|
85.0
|
99.1
|
148
|
222
|
451
|
1,160
|
2,470
|
16,900
|
|
21
|
December
|
80.0
|
101
|
137
|
225
|
485
|
817
|
1,440
|
2,120
|
7,000
|
|
21
|
|
|
Instantaneous minimum flow for period of record =
0.71
cubic feet per second.
The current daily value for 03/22/2017 is 358.0 cubic feet per second.
----
Provisional Data Subject to Revision ----
|