|
03474000
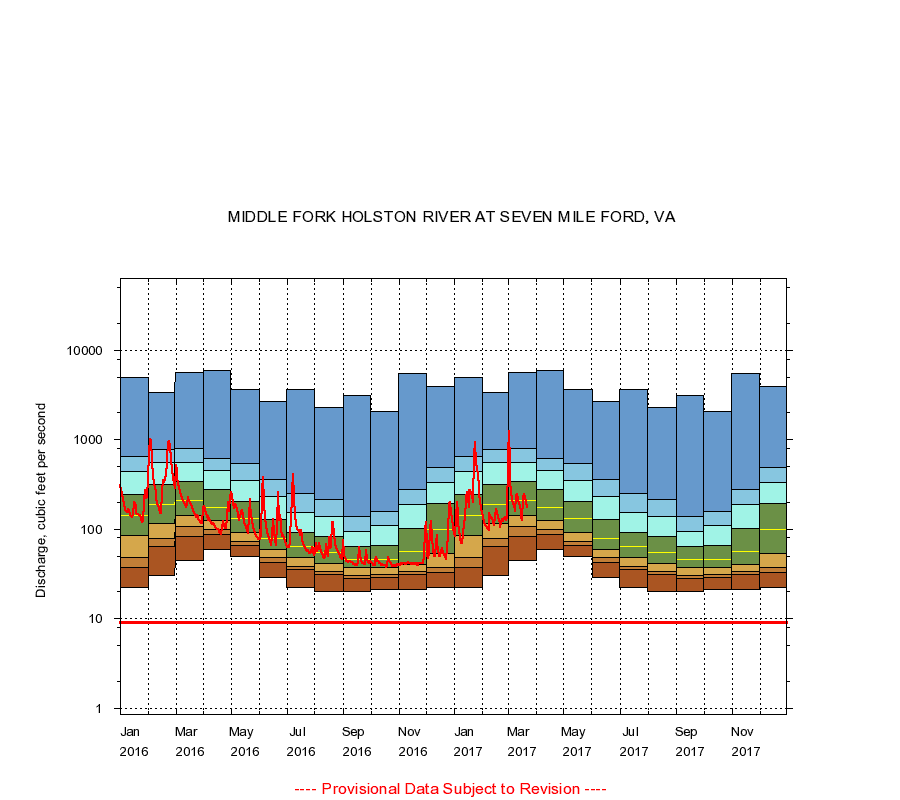
MIDDLE FORK HOLSTON RIVER AT SEVEN MILE FORD, VA
|
Minimum daily flow
|
|
|
5th percentile
|
|
|
|
10th percentile
|
|
|
|
|
25th percentile
|
|
|
|
|
|
Median
|
|
|
|
|
|
|
75th percentile
|
|
|
|
|
|
|
|
90th percentile
|
|
|
|
|
|
|
|
|
95th percentile
|
|
|
|
|
|
|
|
|
|
Maximum daily flow
|
|
|
|
|
|
|
|
|
|
|
|
Years of record
|
January
|
22.0
|
37.0
|
48.1
|
84.2
|
143
|
247
|
445
|
657
|
5,020
|
|
60
|
February
|
30.0
|
64.8
|
79.0
|
116
|
190
|
314
|
554
|
781
|
3,370
|
|
60
|
March
|
45.0
|
83.0
|
106
|
144
|
207
|
341
|
560
|
792
|
5,720
|
|
60
|
April
|
59.0
|
87.0
|
100
|
126
|
174
|
277
|
448
|
620
|
5,990
|
|
60
|
May
|
49.0
|
66.0
|
73.0
|
92.0
|
132
|
204
|
355
|
546
|
3,610
|
|
60
|
June
|
29.0
|
42.0
|
48.0
|
59.0
|
79.0
|
127
|
232
|
363
|
2,670
|
|
60
|
July
|
22.0
|
35.0
|
38.0
|
48.0
|
64.0
|
92.0
|
152
|
251
|
3,700
|
|
60
|
August
|
20.0
|
31.0
|
34.0
|
41.0
|
55.0
|
82.0
|
138
|
214
|
2,290
|
|
60
|
September
|
20.0
|
28.0
|
30.0
|
37.0
|
46.0
|
64.0
|
95.0
|
138
|
3,130
|
|
60
|
October
|
21.0
|
29.0
|
31.0
|
37.0
|
46.0
|
66.0
|
110
|
158
|
2,050
|
|
61
|
November
|
21.0
|
31.0
|
34.0
|
40.0
|
57.0
|
101
|
187
|
276
|
5,480
|
|
61
|
December
|
22.0
|
33.0
|
37.0
|
53.0
|
99.0
|
194
|
335
|
486
|
3,920
|
|
61
|
|
|
Instantaneous minimum flow for period of record =
9.00
cubic feet per second.
The current daily value for 03/22/2017 is 174.0 cubic feet per second.
----
Provisional Data Subject to Revision ----
|